Outcomes & Evidence
Enrollment Impact
What changes when CRO feasibility teams use structured EHR matching instead of manual chart review — directional outcomes from pilot programs.
What changes with Cohortbridge
These directional outcomes reflect results from internal pilot programs with participating health system and CRO partners. They are not peer-reviewed benchmarks.
not weeks
From discovery to confirmation
Manual chart review has two distinct phases: discovery (which patients might be eligible?) and confirmation (are these patients actually eligible based on full chart review?). In the traditional model, CRAs spend most of their time on discovery — reviewing charts to find candidates that should have already been identified from structured EHR data.
Cohortbridge handles the discovery phase. CRA chart review shifts to confirmation — a smaller, higher-value activity focused on verifying eligibility for patients the matching engine has already identified as likely candidates.
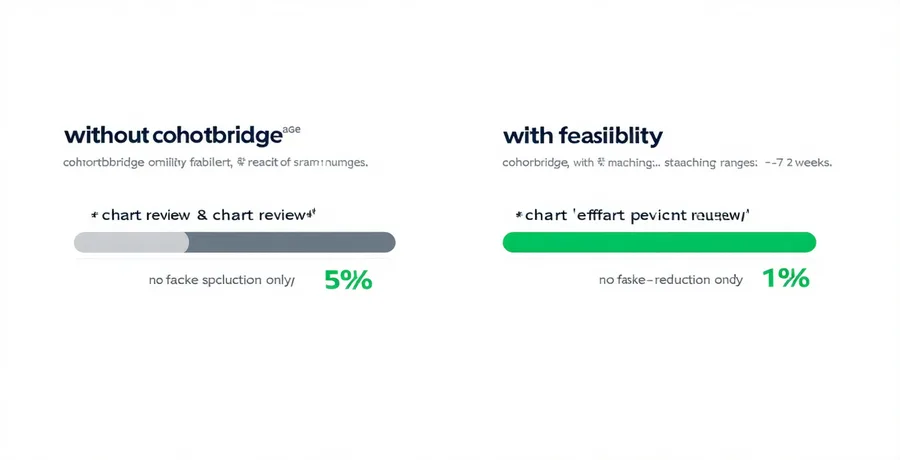
Without Cohortbridge
With Cohortbridge
Directional ranges. Results depend on protocol complexity, EHR data completeness, and site characteristics.
How CROs have used Cohortbridge
These case summaries describe how CRO feasibility teams have applied Cohortbridge to specific trial types. Details are representative of pilot program experiences.
Morrow Clinical Group
A 12-site cardiometabolic Phase II study with narrow inclusion criteria (HbA1c 7.5–10%, no prior insulin, eGFR ≥ 45). Initial site estimates based on historical enrollment predicted 6–8 eligible patients per site.
After running Cohortbridge against Epic populations at 8 connected sites, the team identified that 4 sites had significantly fewer eligible patients than estimated (2–3 each) and 2 sites had substantially more (12–15 each). Site allocation was adjusted before activation — avoiding 4 under-performing site activations and adding 1 higher-yield site.
Halcyon Research Partners
A rare disease oncology Phase III study with an estimated prevalence of 1–2 patients per 10,000 in the general population. Conventional feasibility approaches estimated 1–2 eligible patients per site per year at 15 sites.
Cohortbridge matching across 4 health system EHR networks (combined ~2.3M records) identified a concentrated population at 2 academic medical centers with rare disease specialty practices — sites not on the original activation list. Protocol-specific rare diagnosis codes surfaced patient clusters not visible in historical enrollment data.
What these metrics represent
The enrollment impact data presented on this page reflects directional outcomes from Cohortbridge's internal pilot programs with participating health system and CRO partners in 2024–2025. These outcomes are:
- Not peer-reviewed or independently verified
- Not representative guarantees — individual results vary by protocol complexity, EHR data completeness, and site characteristics
- Reported as directional ranges, not point estimates
- Based on a limited sample of pilot programs — not a large-scale randomized trial
Cohortbridge is an angel-funded company. We believe the directional evidence from our pilot programs is compelling, but we report it honestly as pilot data — not as established clinical research benchmarks.
See a cohort analysis for your protocol
We'll run a sample analysis showing how Cohortbridge would approach your protocol's inclusion/exclusion criteria against a connected EHR dataset.